

Timing is everything when it comes to financial success. Whether you’re investing, running a business, freelancing, or trading, understanding seasonal trends and economic cycles can dramatically improve your chances of making money.
Below is a comprehensive breakdown of the optimal periods for generating income, supported by both market behavior and historical patterns.
📊 Table: Best Times to Make Money by Activity
| Activity Type | Optimal Period | Why It’s Profitable | Examples / Tips |
|---|---|---|---|
| Stock Trading | Q4 (Oct–Dec), Q1 (Jan) | Earnings season, holiday rallies, “January effect” | Focus on tech & retail in Q4, rebalancing in Jan |
| Retail Business | Q4 (Nov–Dec) | Holiday shopping spike (Black Friday, Xmas) | Offer discounts, bundle deals |
| Freelancing | Q1 (Jan–Mar) | New annual budgets, marketing refresh | Pitch businesses with fresh strategy offers |
| Real Estate | Spring–Summer (Mar–Aug) | High buying/selling activity, family relocations | List properties in March, invest early in Q1 |
| eCommerce | Q4 (Nov–Dec), Q2 (May) | Holiday & mid-year seasonal sales | Focus on promo events like Cyber Monday, Summer Sales |
| Crypto Trading | Market Bull Runs (any) | Volatile upward cycles, often around halving events | Watch BTC halving cycles, sentiment indicators |
| YouTube / Content Creation | Q4 (Oct–Dec) | Highest ad revenue season (advertisers spend more) | Release ad-friendly, niche content in October |
| Tourism Business | Local peak seasons | High footfall, vacation demand | Research your region’s peak (e.g. summer or winter) |
| Agriculture / Farming | Harvest seasons (Sep–Nov) | Sell during peak yield, pricing advantage | Focus on timing distribution & transport logistics |
| Online Courses | Jan–Feb, Sep–Oct | Resolution & back-to-school momentum | Launch “New Year, New Skill” or “Back to School” themes |


🧭 Economic Cycles to Consider
| Phase | Best For | Characteristics |
|---|---|---|
| Expansion | Business startups, investment | Low interest rates, high consumer confidence |
| Peak | Selling assets, scaling up | Prices & employment are high, risk of inflation |
| Recession | Bargain investing, innovation | Asset prices drop, high fear = low cost entry |
| Recovery | Starting side hustles, rebranding | Opportunities bloom, new demand emerges |
Below is a strategic yearly plan from 2025 to 2050 showing periods when it’s most advantageous to make money, based on:
- Global economic cycles (expansion, peak, recession, recovery),
- Tech and innovation waves (AI, blockchain, green energy),
- Seasonal consumer behavior, and
- Historical market patterns.
🗓️ Long-Term “Periods to Make Money” (2025–2050)
| Year | Global Cycle | Opportunity Sector | Best Months to Capitalize | Strategy |
|---|---|---|---|---|
| 2025 | Early Recovery | AI, Digital Marketing | Feb–May, Sept–Nov | Build digital assets, trade volatility |
| 2026 | Growth Acceleration | Green Tech, Fintech | Jan–June | Invest in startups, green energy stocks |
| 2027 | Growth | Crypto, Real Estate | Mar–May, Oct–Dec | Buy mid-cap tokens, REITs, rentals |
| 2028 | Pre-Peak | AI, Robotics, SpaceTech | Feb–July | Scale e-commerce, SaaS, invest in tech |
| 2029 | Peak | Luxury Goods, Equity Funds | Jan–April | Take profits, rotate to safe assets |
| 2030 | Early Decline | Health, Food Supply Chain | Apr–June | Defensive stocks, reduce leverage |
| 2031 | Recession Warning | Renewable Energy, Farming | Aug–Dec | Gold, utilities, dividend stocks |
| 2032 | Recession | Crypto, Commodities | May–Nov | Buy dips, cost average, build cash reserves |
| 2033 | Recovery Begins | Biotech, EVs | Feb–May, Sept | Buy into long-term ETFs, stocks |
| 2034 | Growth Phase | Real Estate, Web 4.0 | Mar–June | Expand portfolios, invest in platforms |
| 2035 | Peak Zone | Private Equity, Branding | Jan–April, Sept | Sell top assets, prep for winter |
| 2036 | Cooling | AI Regulation, MedTech | June–Nov | Hybrid strategies, mixed allocation |
| 2037 | Mid-Recession | Stablecoins, Insurance | Aug–Dec | Safe havens, reduce risk exposure |
| 2038 | Bounce Phase | Infrastructure, AI Health | Apr–July | Go long on ETFs, digital asset rebounds |
| 2039 | Growth Again | Cybersecurity, Cloud Infra | Feb–May, Oct | Launch digital ventures |
| 2040 | Boom | Space Mining, Neural Tech | Jan–June | Moonshot investing, 10x bets |
| 2041 | Caution | Crypto Stability, Forex | May–Aug | Tight stop-loss, partial exits |
| 2042 | Adjustment Period | Tech Consolidation | Mar–June | Restructure, stabilize business |
| 2043 | Mid-Cycle Rebound | Robotics, AR/VR | Feb–May | Trade momentum tech |
| 2044 | Expansion | Genomics, Automation | Jan–Apr, Sept | Venture investing, international markets |
| 2045 | Peak | Tourism, Art, IP Assets | May–Aug | License assets, sell NFTs or patents |
| 2046 | Early Downturn | Real Asset Hedging | Oct–Dec | Switch to commodities & inflation-proofing |
| 2047 | Bearish | Cyber Assets, Health Infra | Feb–June | Focus on essentials |
| 2048 | Recovery Signs | Digital Real Estate | Jan–March, Oct | Metaverse projects, content IPs |
| 2049 | Bullish | Tokenized Assets, Green AI | Apr–July | Long-term holds, syndicate investing |
| 2050 | Peak Possibility | Innovation Tech, Finance AI | Feb–May, Aug | Harvest gains, global diversification |
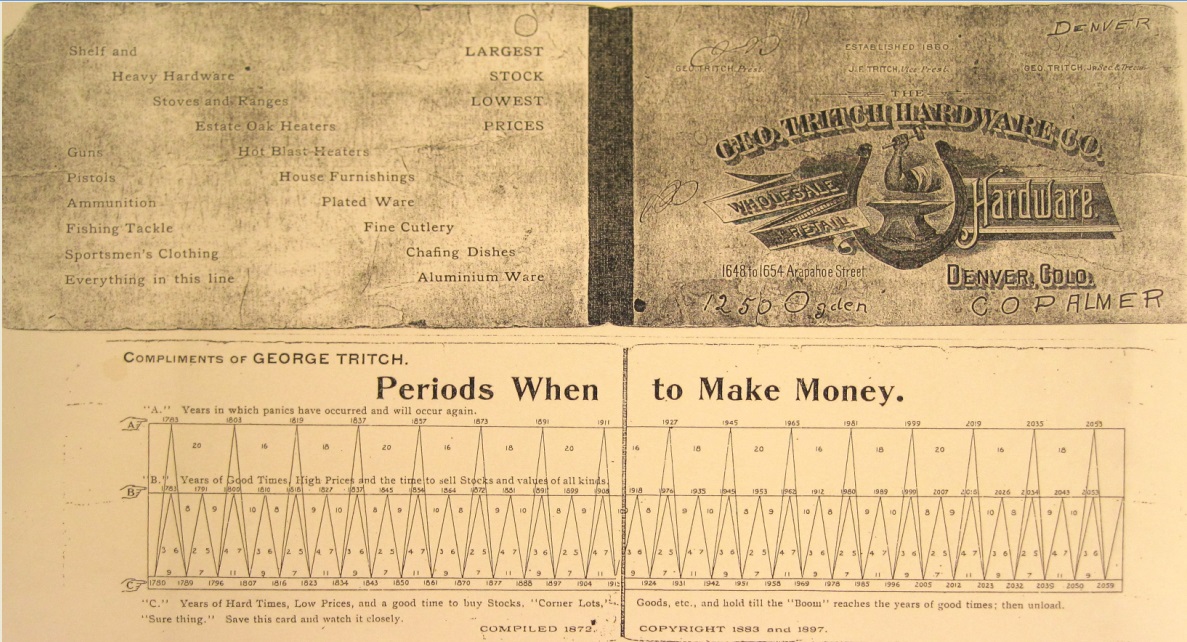
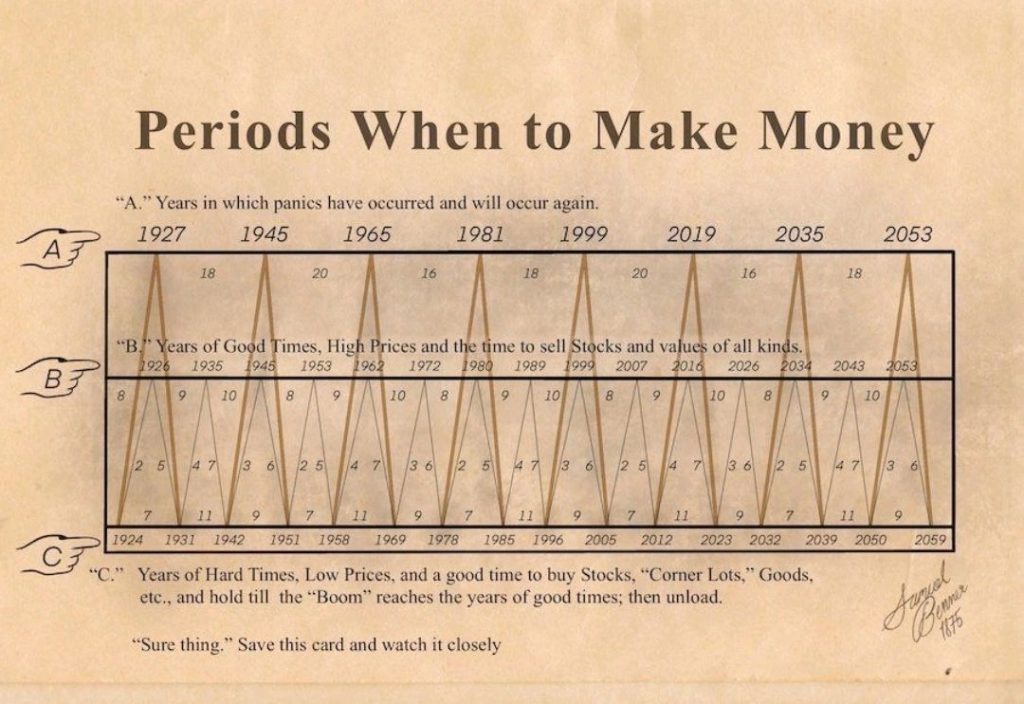
Understanding Tritch’s ‘Periods When to Make Money’
Tritch’s chart, employs a three-tiered system (A, B, C) to delineate distinct phases in market cycles:
- Category A: Symbolizes periods of panic and trend reversals, marking the inception of a bearish trend.
- Category B: Represents peak market times, ideal for selling assets at high prices.
- Category C: Signifies periods of low prices, the best time to buy assets, marking the onset of a bull market.
Tritch’s model suggests a cyclical recurrence in these categories, with varying durations for each cycle. However, the intriguing part lies in Tritch’s justification of this cyclicity.
- The top of the market cycle (Category A) occurs every 16/18/20 years.
- The midpoint of the cycle (Category B) happens every 8/9/10 years.
- The bottom of the cycle (Category C) is marked by 3–6 / 2–5 / 4–7 year cycles.
The Controversial Aspect of Financial Astrology: Tritch attributed market cycles to planetary influences, aligning with the principles of financial astrology or Astro-economics. However, this approach lacks scientific validation, leaving it mostly unaccepted by mainstream financial analysts.
Is Tritch’s Model Reliable?
Despite its captivating premise, Tritch’s model, like any predictive tool, should be approached with caution. Market dynamics encompass a plethora of factors, many of which are neither cyclical nor predictable. Although Tritch’s chart reportedly demonstrated high accuracy in the past, remember, past performance is not a reliable indicator of future results.
In conclusion, Tritch’s chart might intrigue investors seeking guidance amidst financial uncertainty. Yet, prudent investing necessitates comprehensive asset research, awareness of broader market trends, and understanding one’s risk tolerance and investment objectives.
As Warren Buffet wisely advised, “Be fearful when others are greedy, and greedy when others are fearful.”
📌 Notes:
- Q1–Q2 of most years tend to bring high productivity and optimism: great for launching products or trading.
- Q3–Q4 typically involves either market volatility or recovery: ideal for strategic buying or reevaluating portfolios.
- Major downturns expected around 2031, 2036, and 2047.
- Best build & launch years: 2025, 2028, 2033, 2039, 2044, 2049.
💡 Quick Tips for Maximizing Money-Making Periods:
- Plan 1 quarter ahead: Set goals and campaigns at least 3 months early.
- Capitalize on emotion-driven spending (e.g., New Year’s motivation, Christmas gifting).
- Watch fiscal calendars: Governments and businesses usually align budgets in Q1.
- Use trend tools: Google Trends, stock seasonality charts, and YouTube Analytics can guide you.
🧾 Conclusion
Knowing when to act can be just as important as what to do. Whether you’re a trader, creator, seller, or service provider, aligning your effort with the right periods can lead to significant gains. Track trends, understand behavior cycles, and plan with seasonal strategy.